The Gaming KPIs That Actually Matter
Audience: university-level gamers and builders
Goal: a clear, vendor-neutral checklist of what to measure for real-world GPU performance in games—and exactly how to measure it.
Performance metrics glossary
FPS (Frames Per Second) — How many frames your GPU renders each second. Higher = faster, but doesn’t reflect stutter.
Frame time — Time to render one frame (milliseconds). Lower and more even = smoother.
p95 / p99 (95th/99th-percentile frame time) — “Worst typical” frame times. Lower = fewer slow frames; great proxy for smoothness.
1% low / 0.1% low FPS — FPS for the slowest 1% / 0.1% of frames. Higher = steadier play.
Input latency (input-to-photon) — Delay from click/keypress to on-screen change. Lower = snappier feel.
Stutter / hitch — A noticeable pause caused by a slow frame (e.g., shader compiling or VRAM swapping).
Spike count — Number of frames slower than a threshold (e.g., >25 ms). Fewer is better.
Throughput vs consistency — Avg FPS is throughput; p95/1% low capture consistency.
0) Test hygiene (lock this down first)
Fix variables: driver version, game build, API (Application Programming Interface; e.g., DirectX 12 or Vulkan), resolution, preset, display mode (prefer exclusive fullscreen), refresh rate/VRR (Variable Refresh Rate).
Warm up once: first run often compiles shaders and stutters—don’t log it.
Three passes: record 3 identical runs and average them.
One overlay at a time: multiple overlays can cause conflicts or stutter.
1) Speed: Average FPS (frames per second)
What it is: how many frames your GPU renders each second.
Why it matters: quick top-line speed indicator.
How to measure: use a frame-time logger (e.g., PresentMon/CapFrameX/OCAT) or a vendor overlay (AMD Software: Adrenalin Edition / NVIDIA App / Intel Graphics Software).
Read it right: average FPS alone hides stutter—always pair it with the smoothness KPIs below.
2) Smoothness: Frame-time p95/p99 and 1%/0.1% lows
Frame-time percentile (p95/p99): the 95th/99th percentile frame duration in milliseconds; lower = smoother.
1%/0.1% low FPS: converts the “worst typical” frame-times into FPS; higher = steadier.
Why it matters: two rigs can have the same average FPS, but the one with lower p95 (fewer slow frames) feels dramatically better.
How to measure: log per-frame times (PresentMon/CapFrameX/OCAT) and export p95/p99, 1%/0.1% lows.
Quick targets (rule-of-thumb):
60 Hz display → p95 ≤ 16.7 ms
120 Hz display → p95 ≤ 8.3 ms
Healthy run → 1% low ≳ 70% of your average FPS
3) Latency: input-to-photon
What it is: time from your click/keypress to the on-screen response.
Why it matters: determines “snap” in shooters. Frame generation (e.g., AFMF—AMD Fluid Motion Frames; DLSS FG—Deep Learning Super Sampling Frame Generation; XeSS-FG—Xe Super Sampling Frame Generation) boosts apparent FPS but adds latency.
How to measure (at home): record your mouse/keyboard and screen with a 240 fps smartphone in slow-mo; count frames between input and the first visible change.
Pro tools: NVIDIA LDAT (Latency Display Analysis Tool) or Reflex Analyzer monitors.
Report like this:
“Frame-gen ON: 160 apparent FPS; +14–18 ms input latency vs OFF.”
4) Stutter & spike rate
What it is: how often frames exceed a threshold (e.g., >25 ms or >50 ms).
Why it matters: players feel spikes more than small drops in average FPS.
How to measure: use CapFrameX to count spikes; compare “first-run” (shader compile) vs “warmed” runs.
5) VRAM (video RAM) headroom
What it is: peak VRAM use and how close you get to the limit.
Why it matters: running out of VRAM causes hitching and texture pop-in even when average FPS looks fine.
How to measure: log VRAM with HWiNFO or GPU-Z during your run.
Rule-of-thumb: keep ≥0.5–1.0 GB free in heavy scenes; if you’re within a few hundred MB of the limit and see spikes, step texture quality down one notch.
6) Power, thermals, and sustained clocks
What to watch: GPU temperature (and hotspot if available), power draw (board watts), core/memory clocks, fan speed.
Why it matters: thermal or power throttling quietly kills frame-time consistency—especially in laptops.
How to measure: HWiNFO/GPU-Z logs; vendor overlays for a quick glance.
Practical fixes: raise the fan curve, improve airflow, or set a frame cap just below your worst-case FPS to stabilize clocks and noise.
7) Utilization: who’s the bottleneck?
What it is: how busy the GPU is; also watch CPU utilization and the “main thread.”
Why it matters: tells you which settings to change.
CPU-bound: lowering resolution barely changes FPS → reduce crowd density, draw distance, simulation/physics, view distance.
GPU-bound: lowering resolution increases FPS a lot → reduce shadows, ray tracing, volumetrics, or use an upscaler.
How to measure: overlays (Adrenalin/NVIDIA App/Intel), HWiNFO, plus frame-time logs.
8) Feature trade-offs (test them, don’t guess)
Upscaling: FSR (FidelityFX Super Resolution), DLSS (Deep Learning Super Sampling), XeSS (Xe Super Sampling)
Test: Native vs Quality vs Balanced
Record: FPS + p95 + side-by-side screenshots (use NVIDIA ICAT for visual diff)
Frame generation: AFMF/DLSS FG/XeSS-FG
Test: OFF vs ON (often paired with an upscaler Quality mode)
Record: Apparent FPS, latency delta (slow-mo), and any artifacts in fast motions/UI
Low-latency modes: Anti-Lag (AMD), Reflex (NVIDIA), Xe Low Latency (Intel)
Test: OFF vs ON in a GPU-bound scene (benefit is minimal if CPU-bound)
9) Capture/stream overhead
What it is: the FPS and p95 cost of recording your gameplay.
Why it matters: poor capture settings can tank smoothness.
How to measure: run a baseline, then record 30 seconds at H.264/HEVC/AV1 (e.g., OBS Studio, ShadowPlay, or Adrenalin capture) and log the delta.
Tip: start with 1080p60, reasonable bitrate, and look at p95—not just average FPS.
10) Stability (the ultimate pass/fail)
What to log: crashes, device-removed errors, driver resets, reproducible bug scenes.
Why it matters: “fast but flaky” is a non-starter.
How to measure: keep a short incident log with time stamps and the exact scenario.
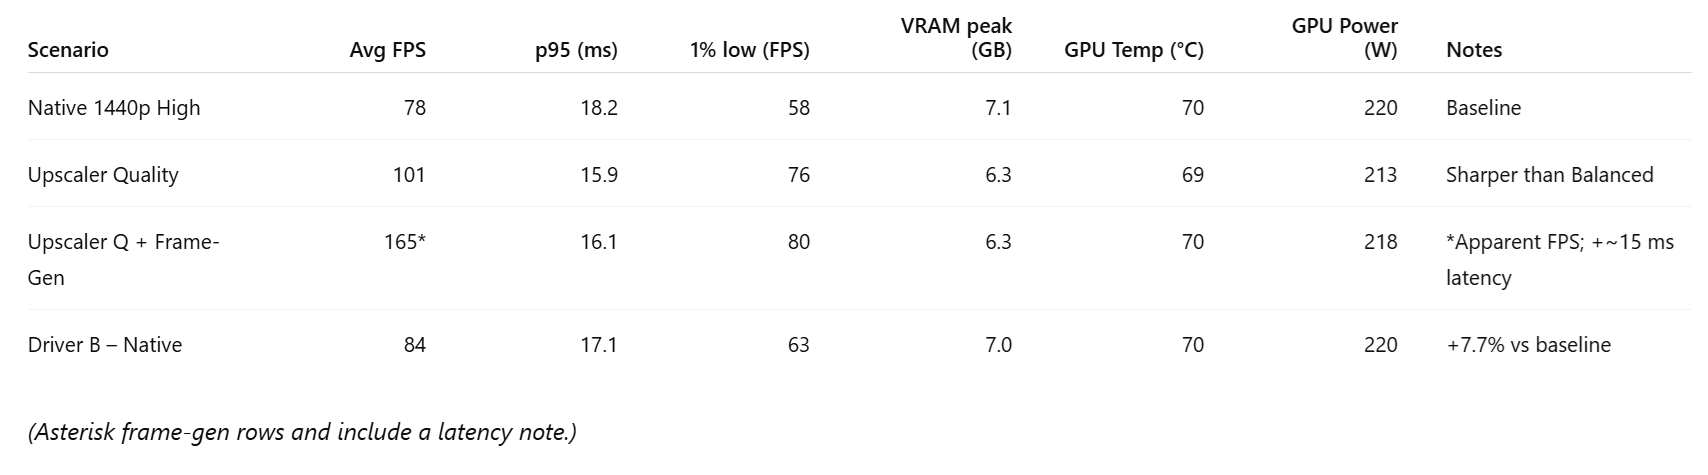
Example reporting template (copy/paste)
Environment: GPU [model] • Driver [version] • CPU [model] • RAM [size/speed] • Game [version] • API [DX12/Vulkan] • Display [resolution @ Hz] • Mode [exclusive fullscreen]
What “good” looks like (quick heuristics)
Smoothness: p95 is low and stable across passes; 1% low is close to average FPS.
Latency: competitive shooters feel snappy (low measured input delay); single-player can trade some latency for higher apparent FPS if you like the feel.
VRAM: you’re not flirting with the limit; hitches vanish when you step textures down one notch.
Thermals: clocks don’t sag mid-run; p95 doesn’t drift upward over time.
Repeatability: three passes agree within ~3–5%.
Minimal tools to get all KPIs
Frame-times: PresentMon + CapFrameX (GUI) or OCAT
Sensors: HWiNFO or GPU-Z
Latency (quick): 240 fps phone slow-mo
Image quality: NVIDIA ICAT (for screenshot/clip comparisons)
Vendor overlays (one at a time): AMD Adrenalin, NVIDIA App, Intel Graphics Software for quick HUDs and driver updates
Bottom line
Judge gaming performance by speed + smoothness + latency + stability, not just average FPS. If you pair average FPS with frame-time p95/1% lows, watch VRAM headroom and thermals, and test feature stacks (upscaling, frame-gen, low-latency modes) one at a time, you’ll both feel and prove the real gains—clearly, repeatably, and professionally.