The Industry-standard Toolkit to Measure GPU Performance
Audience: university-level gamers/builders
Goal: show exactly which tools the industry uses to record the key GPU performance KPIs—and how to use them cleanly.
KPIs we’ll capture: average FPS (frames per second), frame-time p95/1% low (smoothness), latency (input-to-screen), VRAM usage, power/thermals, stability, and image quality.
FPS (frames per second): how many frames are drawn each second.
p95/p99 frame-time: 95th/99th percentile frame duration; lower is smoother.
1% low: FPS level exceeded by 99% of frames (proxy for worst-case smoothness).
VRR (variable refresh rate): monitor adjusts refresh to match FPS, reducing tearing/stutter.
API (application programming interface): graphics interface (DirectX 12, Vulkan).
VRAM (video random-access memory): dedicated memory on the GPU for textures/buffers.
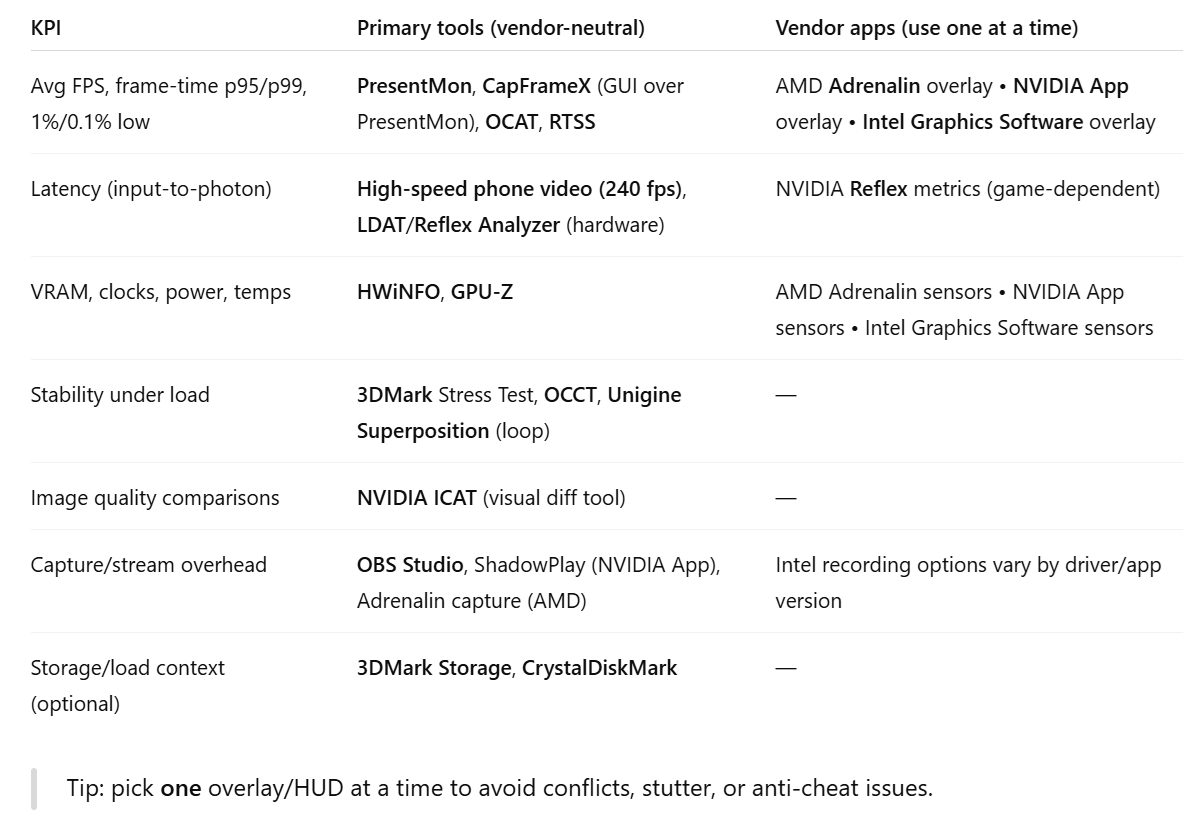
2) Core, Vendor-Neutral Tools (the reviewer’s foundation)
PresentMon (frame-time capture engine)
What it does: logs every frame’s time for DirectX/Vulkan.
Why it matters: lets you compute p95/p99 frame-time and 1%/0.1% low FPS—the smoothness metrics that averages hide.
How to use: run from CLI or through a GUI like CapFrameX; capture 3 passes and average.
CapFrameX (friendly GUI over PresentMon)
What it does: start/stop runs, compute p95/1% lows, show stutter counts, export charts/CSV.
Pro move: tag each run with driver version, API (DirectX 12/Vulkan), preset, and feature toggles (FSR/DLSS/XeSS, frame-gen).
OCAT (Open Capture and Analytics Tool)
What it does: lightweight overlay + logging (also PresentMon-based).
Use it when: you want simple, low-overhead capture without extra analysis.
RTSS (RivaTuner Statistics Server)
What it does: OSD (on-screen display) and frame-time logging (bundled with MSI Afterburner).
Caveat: avoid stacking RTSS with other overlays.
HWiNFO / GPU-Z (sensors)
What they do: log GPU temperature/hotspot, clocks, board power, VRAM—vital for diagnosing thermal throttling or memory pressure.
Pro move: log sensors to CSV during each benchmark pass.
3DMark / OCCT / Superposition (synthetics & stress)
What they do: highly repeatable stress to compare driver A vs B and catch unstable OCs, VRAM errors, or cooling limits.
OBS Studio / ShadowPlay / Adrenalin capture (overhead checks)
What they do: measure the FPS and p95 cost of recording (e.g., AV1 vs H.264, different bitrates).
Method: run a scene, then repeat while recording; log deltas.
NVIDIA ICAT (Image Comparison & Analysis Tool)
What it does: side-by-side frame/clip scrubbing and zoom to compare upscaler modes (Quality/Balanced) or frame-gen artifacts at the same camera frame.
High-speed phone video (240 fps) / LDAT / Reflex Analyzer (latency)
What they do: measure input-to-screen latency. A phone gives good estimates; LDAT/Reflex Analyzer are lab-grade.
3) Vendor Apps (quick overlays & one-stop controls)
These are convenient and improving rapidly. Use them for overlays, driver updates, capture, and basic tuning—but keep runs consistent and avoid running more than one at a time.
AMD — Software: Adrenalin Edition - Performance Tuning and Metrics
Use for: performance overlay (FPS, frame-time trend), driver updates, capture/instant replay, HYPR-RX presets (Anti-Lag, AFMF frame-gen, RSR upscaling, Boost), per-game profiles, basic tuning.
Why it’s useful: fast Day-0 installs, one-click performance stacks, easy sensor HUD.
NVIDIA — NVIDIA App
Use for: Game Ready/Studio driver updates, performance HUD, ShadowPlay capture (incl. AV1), game optimization, DLSS model overrides (per-title), Smooth Motion (driver-level interpolation on supported GPUs).
Why it’s useful: modern HUD + capture + DLSS controls in one spot.
Intel — Intel Graphics Software
Use for: per-game profiles, display/VRR settings, telemetry (FPS/temps/clocks), and (on Arc) basic tuning.
Why it’s useful: a single hub for iGPU/Arc users; pair with PresentMon for deeper analysis.
4) A Repeatable Workflow (so your numbers are trusted)
A) Prepare the scene
Fix variables: resolution (e.g., 2560×1440), preset (High), API (DX12/Vulkan), display mode (exclusive fullscreen), driver version.
Warm-up pass: build shader caches; don’t log the first run after a driver change.
B) Log every pass
Capture: CapFrameX (frametimes) + HWiNFO (sensors).
Runs: 3 passes per scenario; average them.
Record: avg FPS, p95/p99 frame-time, 1% low, VRAM peak/headroom, GPU temp/power, notes (any hitch/crash).
C) Compare software stacks one variable at a time
Drivers: Driver A vs Driver B (same game build/settings).
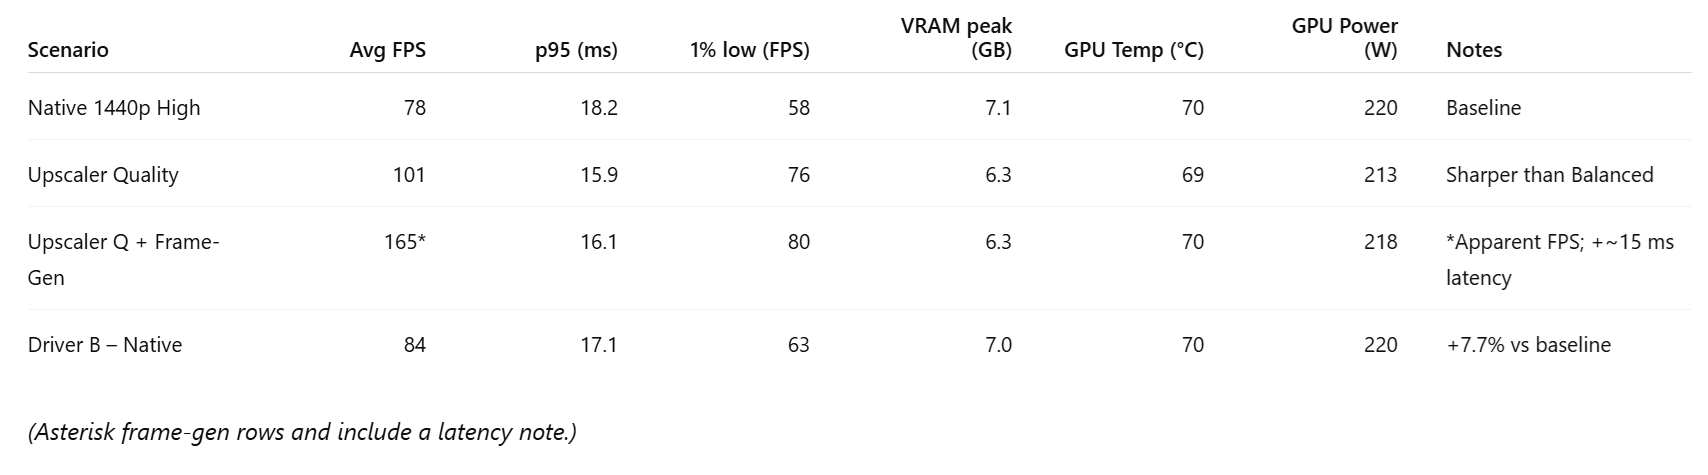
Upscalers: Native vs FSR/DLSS/XeSS Quality (add Balanced if you like).
Frame-gen: Off vs On (AFMF/DLSS FG/XeSS-FG). Label frame-gen results as “apparent FPS” and do a quick latency spot-check.
Latency modes: Off vs On (Anti-Lag/Reflex/Xe Low Latency) in a twitchy scene.
Platform toggles: Resizable BAR/SAM Off vs On (note BIOS/UEFI state).
D) Publish with context
Include a small methods box: GPU/CPU/RAM, driver version, game version, API, resolution/preset, toggles, ambient temp. Readers should be able to reproduce your run.
5) Example Data Sheet (drop-in template)
Environment: GPU [model] • Driver [ver] • CPU [model] • RAM [size/speed] • Game [ver] • API [DX12/Vulkan] • Display [res@Hz]
6) Do’s and Don’ts (learned the hard way)
Do
Use the same scene/route every time; if a game has a built-in benchmark, start there.
Report p95/1% lows alongside averages; smoothness matters.
Log VRAM and temps/power—they explain stutters and throttling.
Label driver versions and feature toggles (FSR/DLSS/XeSS, frame-gen, Anti-Lag/Reflex).
Don’t
Stack multiple overlays; it invites conflicts and noise.
Mix APIs (DX12 vs Vulkan) between runs.
Compare cold vs warm system states (throttling will fool you).
Present frame-gen as raw FPS without the latency context.
7) Minimal Student Kit vs. Reviewer Kit
Student kit (fast, free, good enough)
CapFrameX + PresentMon, HWiNFO, one built-in game benchmark, high-speed phone video.
Reviewer kit (deeper coverage)
Above, plus: 3DMark (Time Spy/Port Royal/Speed Way + Stress), OCCT, Superposition loop, NVIDIA ICAT, OBS Studio, LDAT/Reflex Analyzer (if available).
Nvidia Performance Measurement Tools
AMD Performance Measurement Tools
Intel Performance Measurement Tools
Bottom line
With PresentMon/CapFrameX for frame-times, HWiNFO for sensors, and a single vendor overlay for convenience, you can capture average FPS, p95/1% lows, latency, VRAM, thermals, stability, and image quality like a pro. Add vendor hubs—AMD Adrenalin, NVIDIA App, Intel Graphics Software—for Day-0 drivers and quick HUDs, but keep your method tight: one change at a time, three passes, warm-up first, and always label your runs.